Overview
Graph Theoretical Network Analysis (Gretna) refers to the construction and graph-based analyses of brain connectomes, which was developed by Dr Jinhui Wang and Dr Xindi Wang at the Imaging Connectomics Lab at Beijing Normal University.
The Gretna includes four main modules as follows: i) FC Matrix Construction that allows researchers to build functional connectomes of the human brain derived from functional MRI data; ii) Network Analysis that computes various graph theoretical measures (e.g., small-world, modules and hubs) of structural and functional connectomes of the brain derived from different imaging modalities (e.g., structural MRI, functional MRI, diffusion MRI, EEG/MEG, PET, and fNIRS) in different species (e.g., human, monkey, and rat); iii) Metric Comparison that performs statistical analyses of brain network measures; and iv) Metric Plotting that performs results plotting of brain network analyses. The Gretna works well with a variety of imaging analysis and visualization tools such as PANDA and BrainNet Viewer.
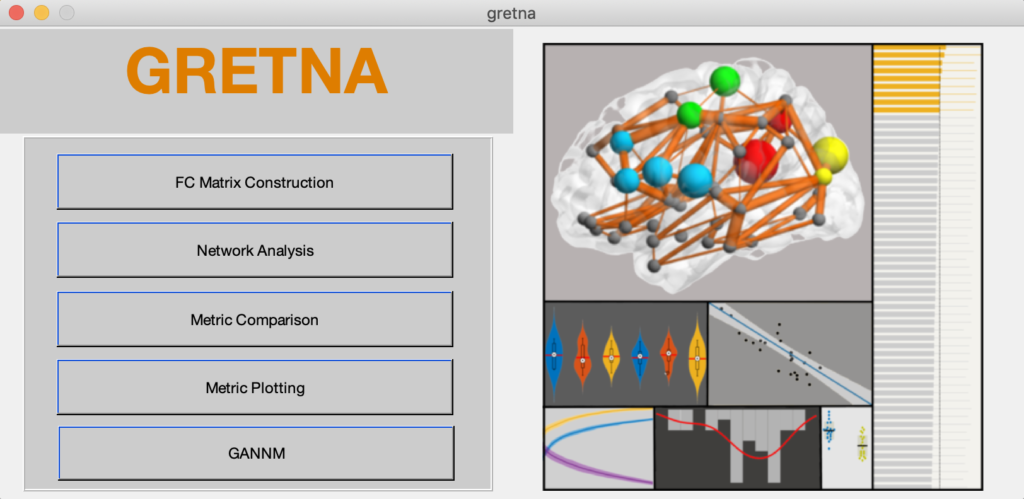 Fig. 1 A graphical user interface of Gretna
The Gretna has several important features as follows:
An open-source, cross-platform (Windows and UNIX OS), Matlab-based software package with a graphical user interface (GUI);
Parallel computing of the topological properties of brain networks, including structural network, functional network, metabolic network, and electrophysiological network in different species (e.g., human, monkey, and rat);
Flexible strategies for graph-based network analysis, including various approaches for defining network nodes (structurally, functionally, or randomly) and edges (positive or negative correlation processing, binary or weighted, and the choices of threshold);
Statistical analysis of group comparisons on the global, nodal and connectional network metrics, and statistical analysis of the relationship between network-behavioral/clinical variable(s);
Various options for both resting-state MRI image preprocessing and functional network construction (including static and dynamic functional connectivity).
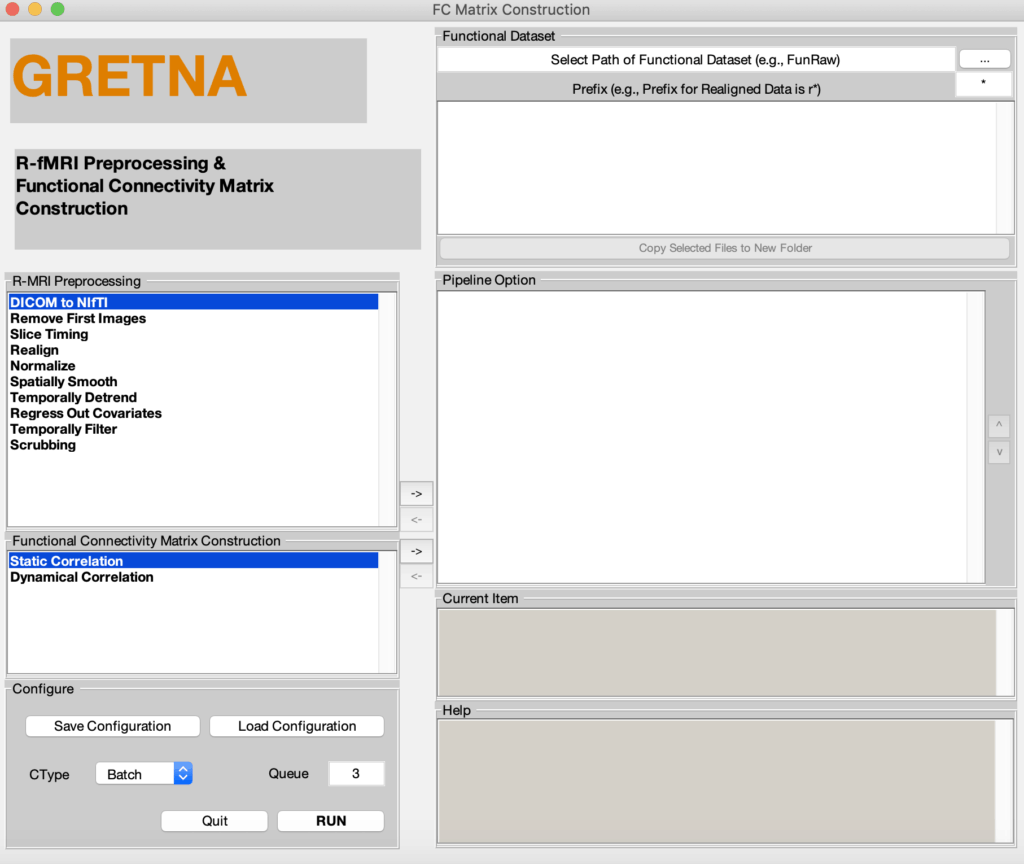
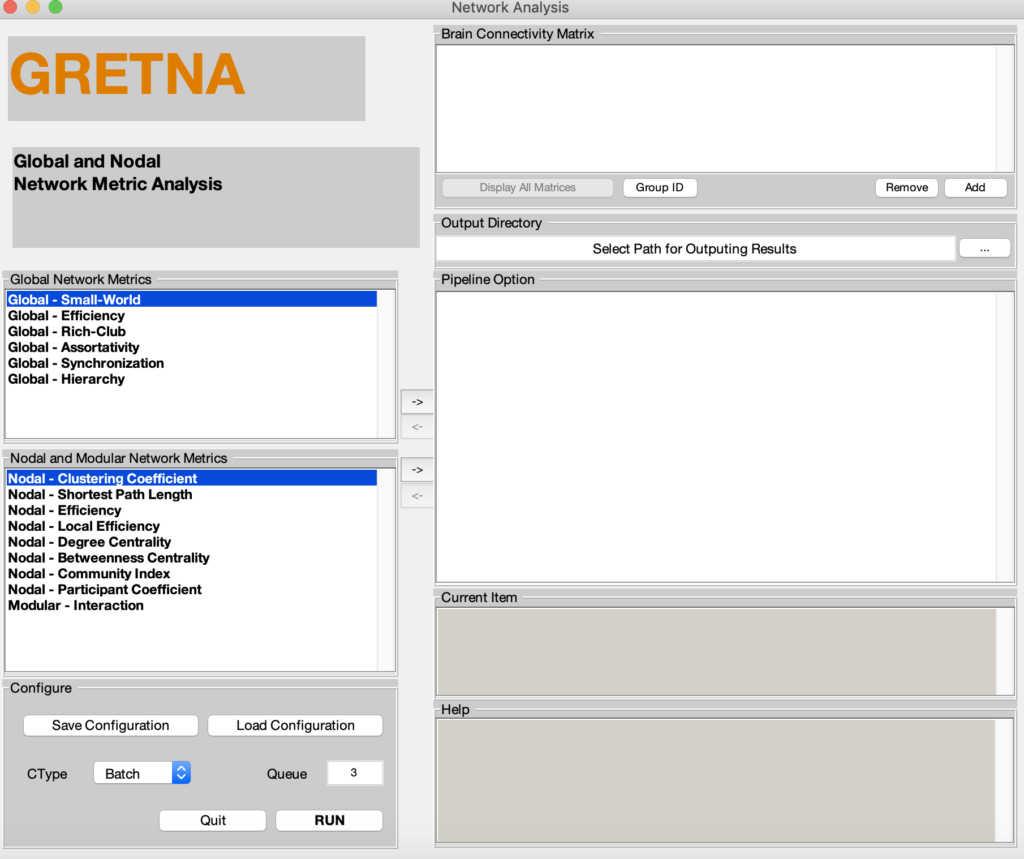
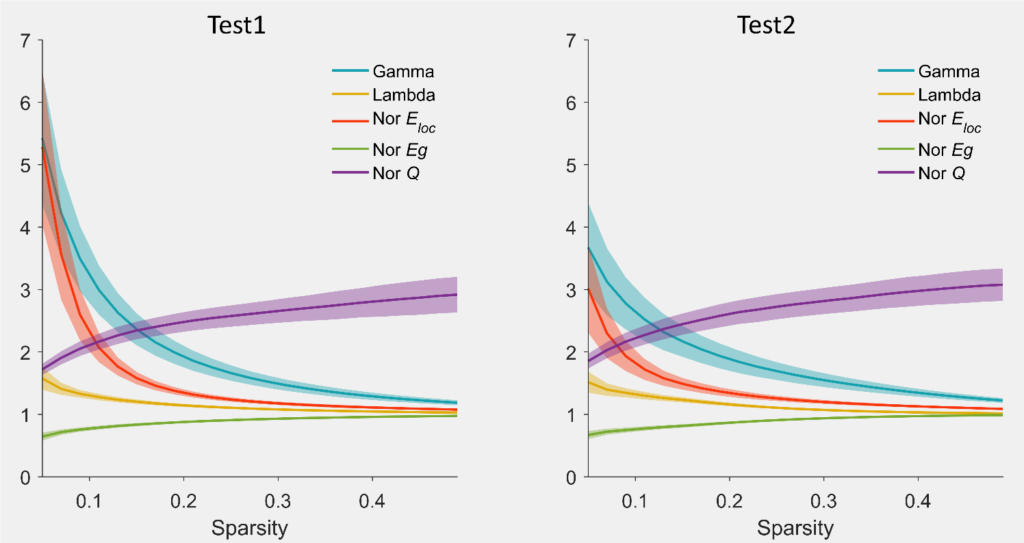 Fig. 2 Three graphical user interface of fMRI preprocessing pipeline (upper), graph-based network analyses (middle), and result plotting of network analyses (bottom)
Download
The GRETNA is freely available on the NITRC website: www.nitrc.org/projects/gretna. If any questions, please visit https://www.nitrc.org/forum/forum.php?forum_id=9351 for help.
Citation
The following article should be referenced while using this tool.
Wang J, Wang X, Xia M, Liao X, Evans A and He Y (2015). GRETNA: a graph theoretical network analysis toolbox for imaging connectomics. Front Hum Neurosci 9:386. [ESI Highly Cited Paper] [Citation: 930+] [PDF]